


Data Visualisation Tools development
Tools that turn complex data into charts and dashboards people can read at a glance.

AI Solutions & Services

Build

Secure & Comply

Design & Discovery
Not sure where to start with AI?
Check your readiness in a few minutes.
BIG 4 · SOLUTIONS-LED

Industry 4.0 & AgTech

AdTech & MarTech

Smart Cities & PropTech

SportsTech & Entertainment
Not sure where to start with AI?
Check your readiness in a few minutes.
 About Go WombatOur company, expertise and leadership
 CareersOpen roles and opportunities at Go Wombat
 Our CultureValues, collaboration and life at Go Wombat
 PartnershipTechnology and delivery partnerships
 Impact & SustainabilityOur social and environmental commitments
 Sustainability ReportOur sustainable development initiatives and annual report
Connect your data sources and build dashboards around the decisions your team needs to make. Explore our ListAcross and Cultural Calculator case studies, then discuss your reporting, integration and visualisation needs.

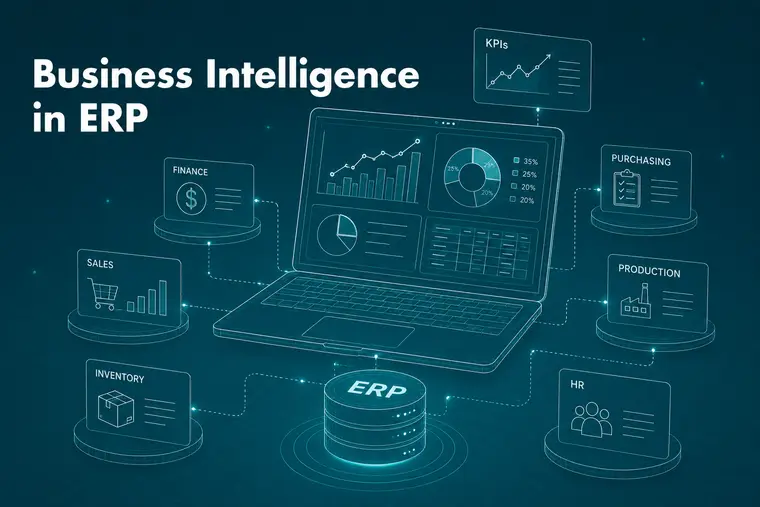
Go Wombat builds business intelligence and data visualisation solutions: custom dashboards, analytics and reporting connected to your own data sources.
What business intelligence (BI) gives your organisation:
Decisions based on timely, accurate data.
Spot market trends and opportunities earlier.
Find redundant work and allocate resources where they are needed.
A clear view of business performance helps you set realistic goals.
Understanding customer behaviour and preferences helps you tailor products and services.
Optimise resources and reduce unnecessary expenses.
We integrate BI with your existing cloud data platforms and business software, so visualisations draw on data from your own systems. Through APIs we can also embed reports and dashboards in custom applications.
Connect to Enterprise Resource Planning (ERP) systems for a unified view of operational data.
Connect with Customer Relationship Management (CRM) tools to gain insights into customer interactions and improve relationship management.
Integrate with popular cloud storage solutions to access and analyse data stored in cloud repositories.
Connect with various databases to pull data from multiple sources, ensuring a comprehensive dataset for analysis.
Exchange data with other software applications through APIs.
Data visualisation presents information as charts, graphs, maps and other visuals, which makes trends, outliers and patterns easier to see. In business intelligence, it is how people read the data behind their decisions.
Our data scientists and visualisation specialists start by identifying your key metrics, data sources and requirements. We then build interactive dashboards and reports for tracking KPIs and spotting issues and opportunities, either as custom dashboards or on tools such as Tableau, Power BI and Metabase.
We also advise on aligning your business intelligence and data visualisation strategy with your business goals, including:
Data architecture design for effective BI systems
Data integration from ERP, CRM and other source systems
Selecting the right BI platforms and tools
Data governance best practices
Building a data-driven culture at your organisation
Our advice draws on our own work building, implementing and supporting BI solutions.

Good data visualisation helps you make informed decisions faster and spot opportunities.

Dynamic dashboards that allow users to interact with and explore data, providing a comprehensive overview of key metrics and KPIs.

Data from different sources combined into one view for more accurate analysis.

Charts, graphs, maps and other techniques chosen to fit the data and the question.

Team members can share insights, reports and visualisations with each other.

Access controls and security measures that protect sensitive data and support compliance with industry regulations and standards.

Provide users with access to BI tools and insights on mobile devices, facilitating decision-making on the go.
Dynamic dashboards that allow users to interact with and explore data, providing a comprehensive overview of key metrics and KPIs.
Data from different sources combined into one view for more accurate analysis.
Charts, graphs, maps and other techniques chosen to fit the data and the question.
Team members can share insights, reports and visualisations with each other.
Access controls and security measures that protect sensitive data and support compliance with industry regulations and standards.
Provide users with access to BI tools and insights on mobile devices, facilitating decision-making on the go.
Typical uses:

We build BI solutions for organisations in industries such as:
The stages of a business intelligence and data visualisation project:




01
02
We build on BI platforms such as Looker, Metabase and Tableau, and connect them to cloud data platforms like Snowflake, Azure and AWS or to on-premise databases. Where these tools reach their limits, we build custom visualisations in code.


Selected case studies
Culture management platform
Human Resources, Business Consulting
March 2021 - Ongoing

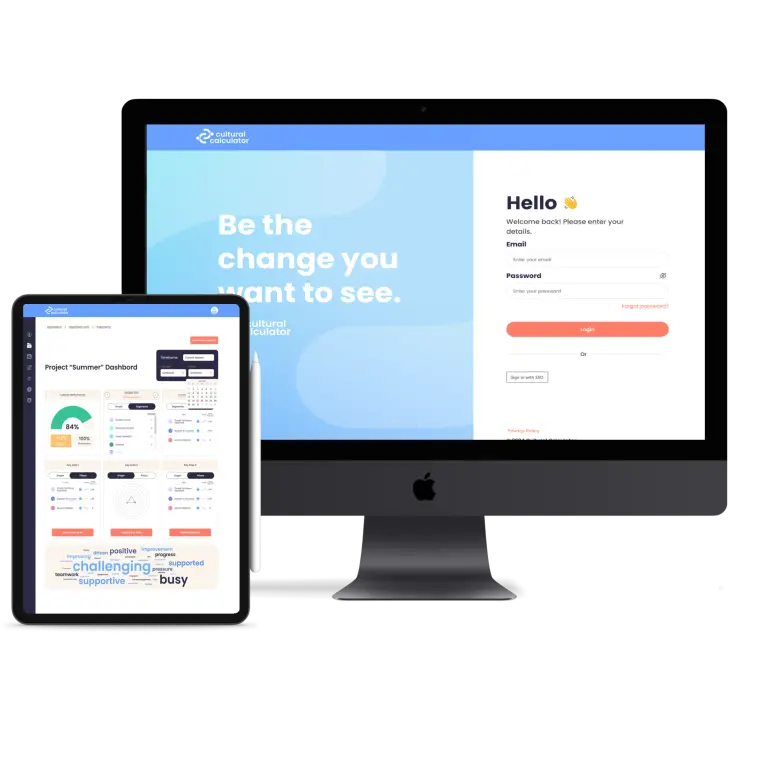
The Cultural Calculator is a business management software which empowers businesses to lead, track and manage workplace culture at scale. The web-based platform turns a company’s target culture into feedback tools. It combines team pulse surveys with an end-to-end personal development feedback system to produce business intelligence. Data is visualised for every team level, so each team can see its cultural strengths and the problems that need its attention.
Ecommerce & Marketplace
November 2020 - December 2021

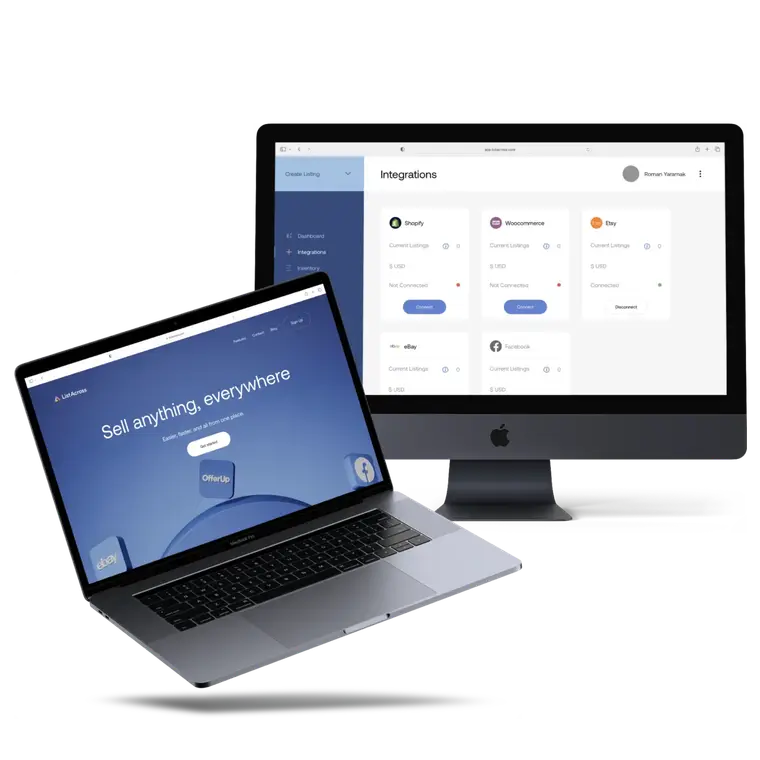
ListAcross lets sellers manage sales of their goods on several online marketplaces at once, such as eBay, Facebook and Etsy. Users add and edit items, change stock quantities and get information about sold items. Changes are synced to all connected marketplaces in real time. Sellers also read and reply to all incoming messages on one page, without switching between sites or messengers.
AI benchmarking platform
Fintech
September 2019 - April 2020
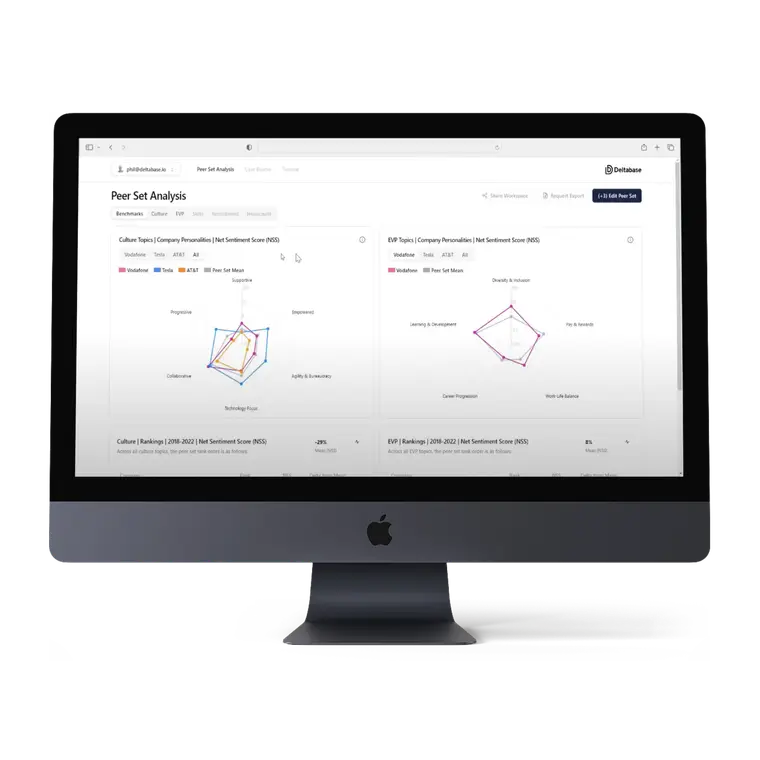
When we worked with Deltabase, it was an AI benchmarking platform that let potential investors evaluate and compare companies by requesting intelligence reports. It collected and processed data on companies from open sources worldwide and benchmarked business performance against competitors.
Business intelligence (BI) turns raw data into information you can act on, which leads to better decisions.
We work with financial, operational, customer and other business data, so you can see the whole business in one place.
Data visualisation is done through specialised business intelligence (BI) software and data visualisation tools like Tableau, Microsoft Power BI, Qlik Sense, D3.js and Google Charts. These tools provide interactive data visualisations and analytics.
Business intelligence (BI) refers to the technologies, applications and practices used by organisations to collect, integrate and analyse data to make better business decisions. Data visualisation is a key component of BI focused on the visual representation of data analytics.
Common data visualisation types include bar charts, line graphs, pie charts, scatter plots, heat maps, treemaps, gauges, geographic maps, histograms, box plots, and more. Selecting the right visual depends on the story you want to tell.